All examples
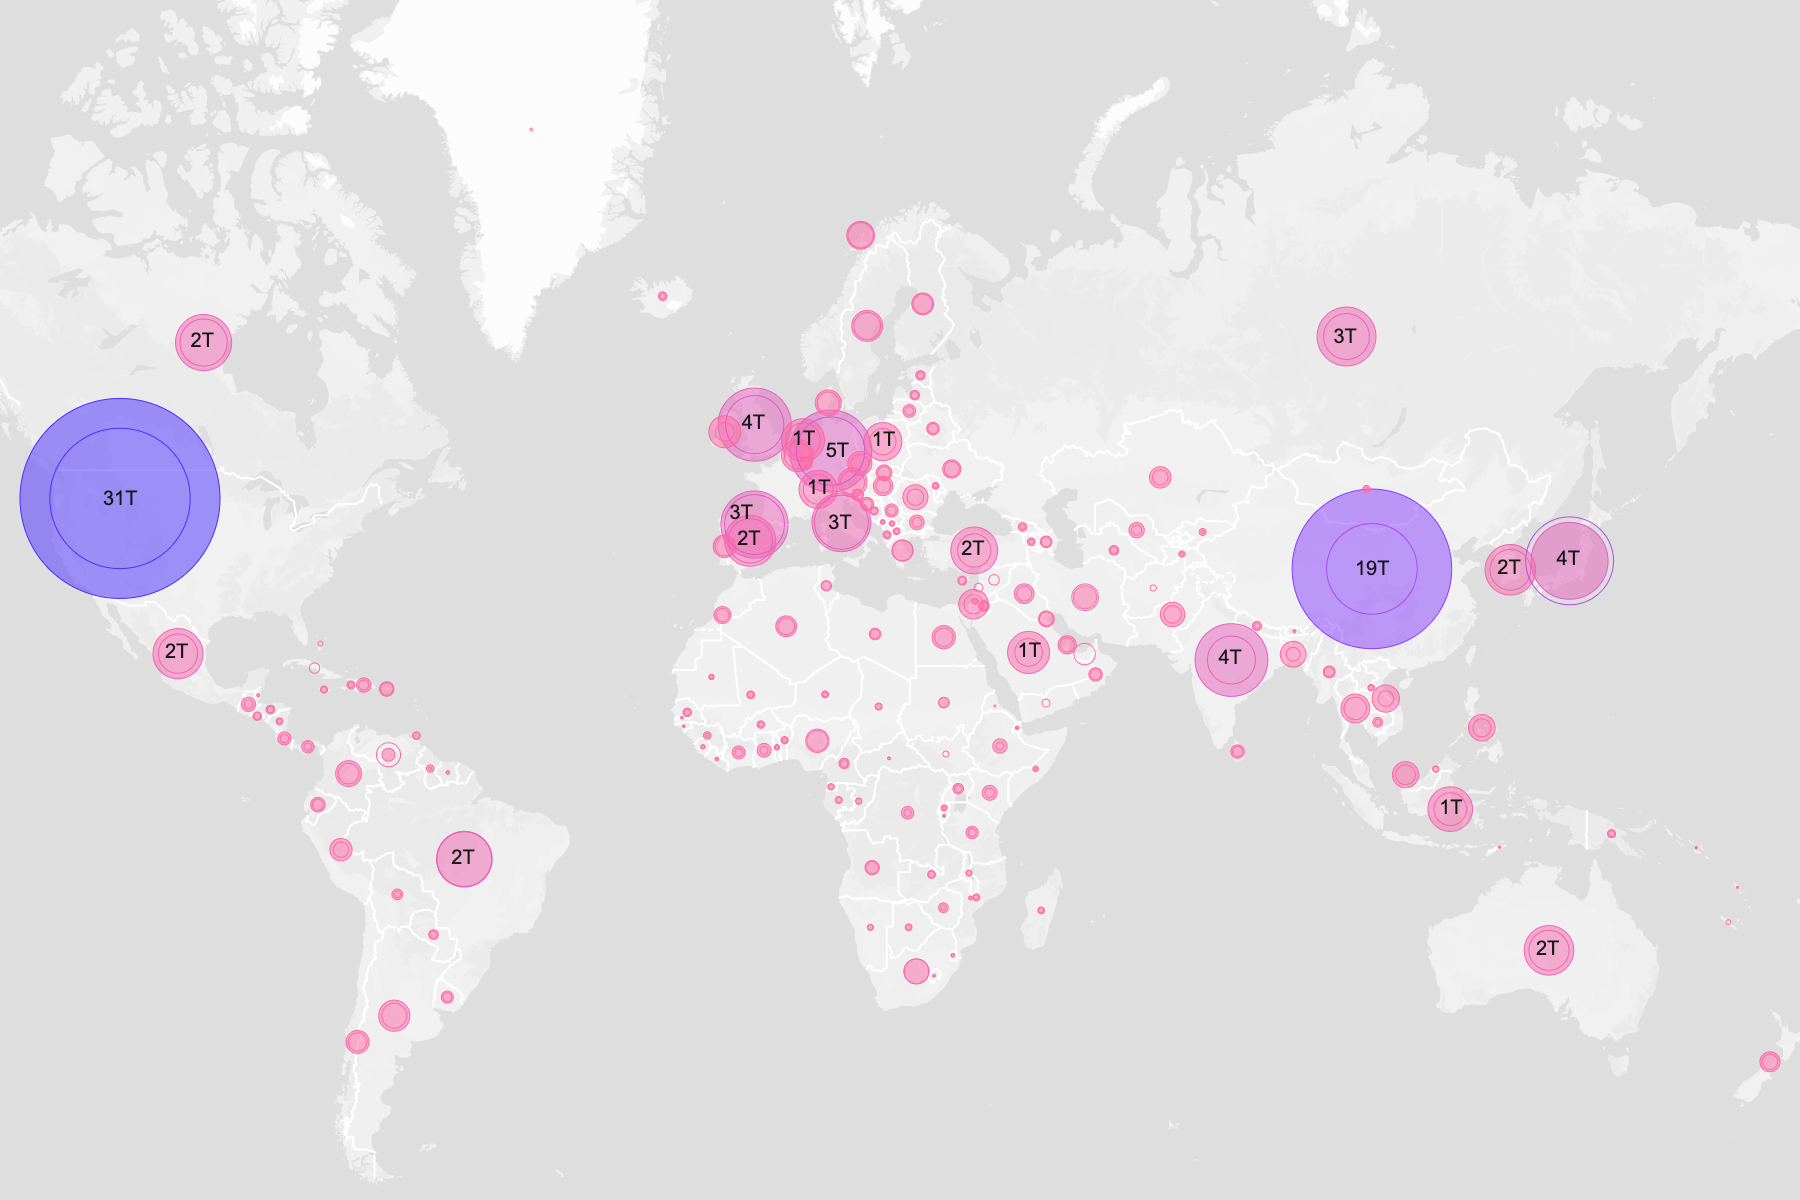
Global GDP Bubble Map
Start with World Bank GDP data—no map geometry required. Basismap automatically matches each country to its location, letting you create a proportional symbol map in seconds. Then duplicate the layer and compare different years to reveal how the global economy has evolved.
Dataset
Ideas to explore
- Automatically match country names to map locations
- Import as Points to create a bubble map
- Scale circles using any year in the dataset
- Duplicate the layer and choose another year to compare growth over time
- Style older years with outlines and recent years with filled circles to highlight change
Ready to try it?
Create a new map, load the source data, and use this example as a starting point for your own editorial or design project.