Load the hurricane GeoJSON
Start with a GeoJSON file that includes forecast points, connecting track segments, and a cone polygon. Upload the file as a new map so each geometry type can be styled in place.
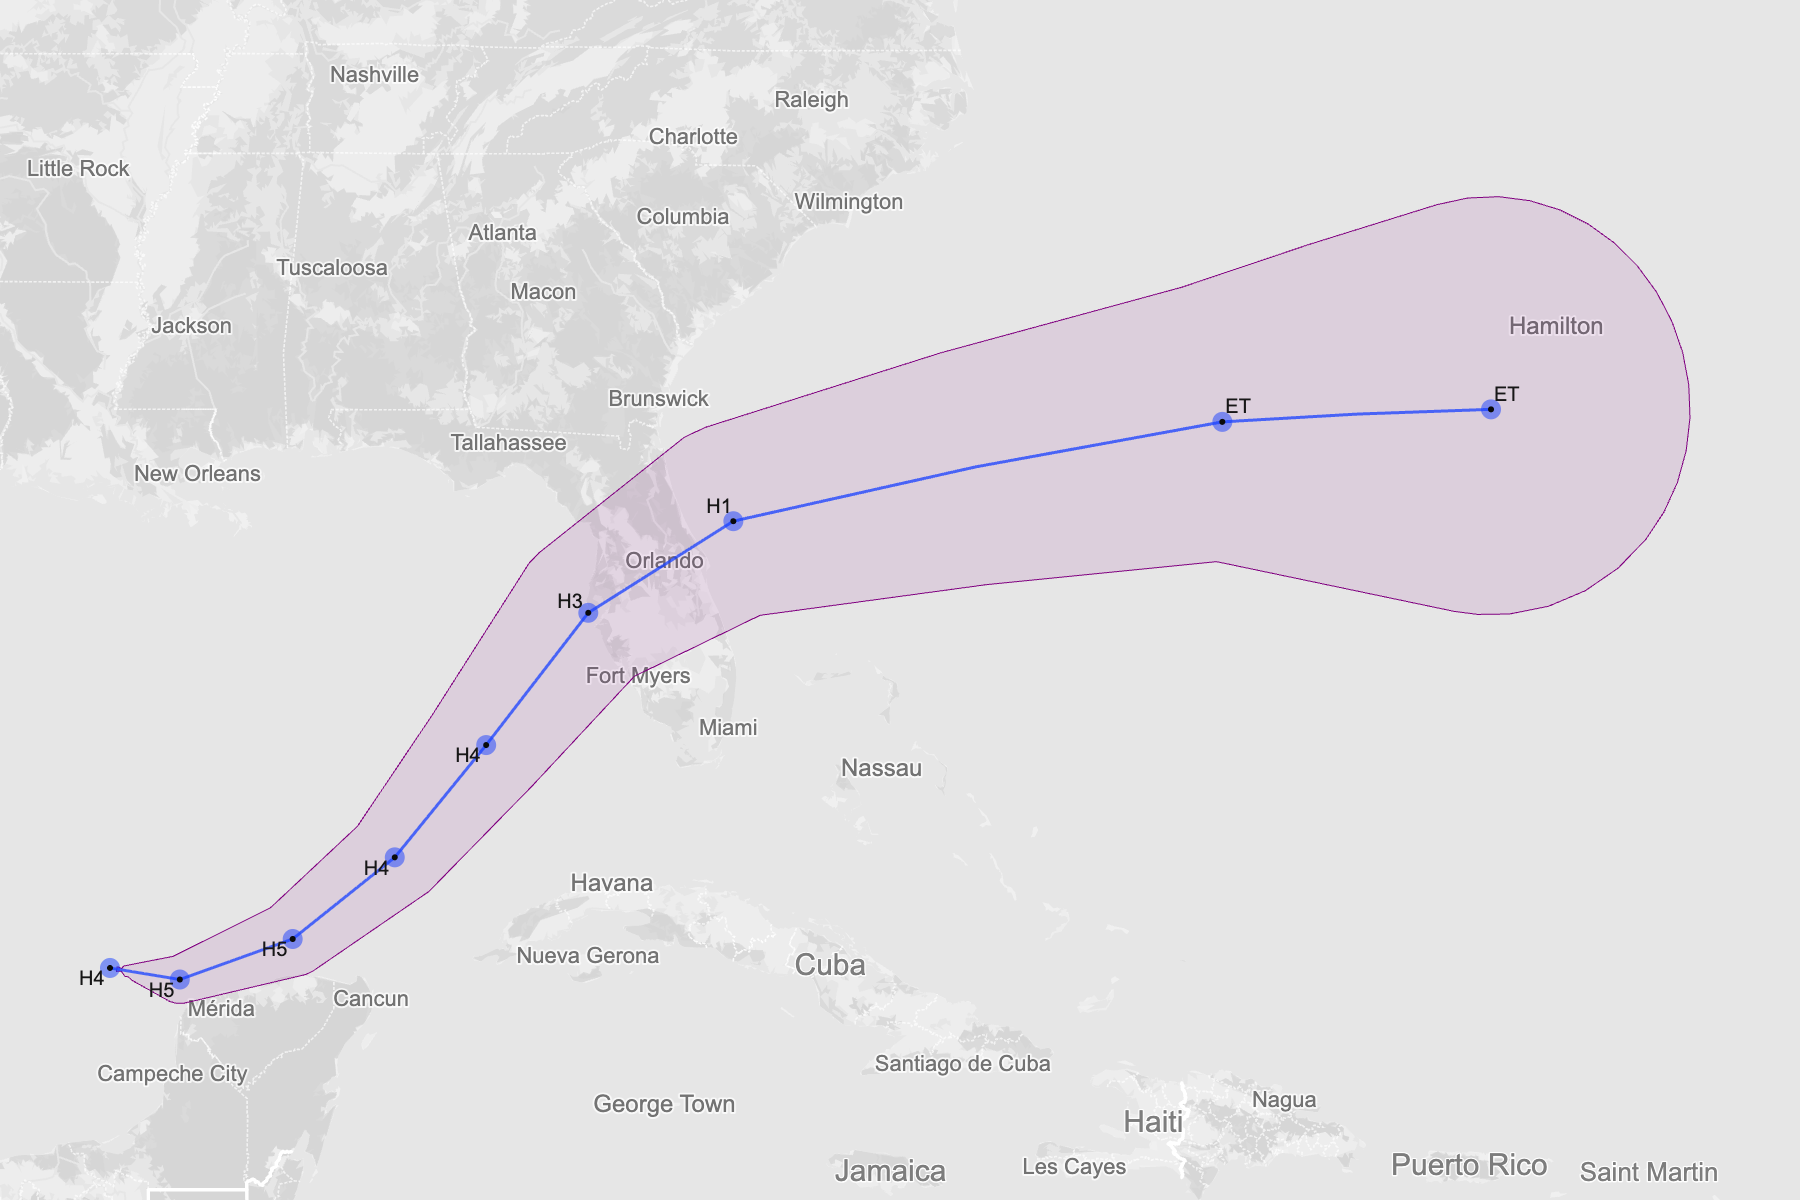
Build a hurricane track and forecast-cone map from advisory-based GeoJSON with points, lines, and a cone polygon.
Start with a GeoJSON file that includes forecast points, connecting track segments, and a cone polygon. Upload the file as a new map so each geometry type can be styled in place.
The forecast cone should read as context rather than overpowering the storm track. Use a translucent fill, a subtle outline, and keep the cone below the track and points in the layer stack.
Readers should be able to follow the storm path quickly. Style the track line with a clear stroke, then size or color the points by category or wind so changes in storm intensity are visible.
Not every forecast point needs a label. Label only the most important positions, such as the current advisory point, landfall-adjacent points, or major category changes, so the map stays readable.
Once the hierarchy feels right, export SVG for illustration workflows or PNG for quick publishing. The result works well for explainers, recap graphics, and historical storm comparisons.
Create a new map, load the source data, and use this workflow as a starting point for your own editorial or design project.