Load the source URL
Build the map from a public earthquake feed so the source can be refreshed later. Paste the USGS GeoJSON query URL to create the layer directly from the source.
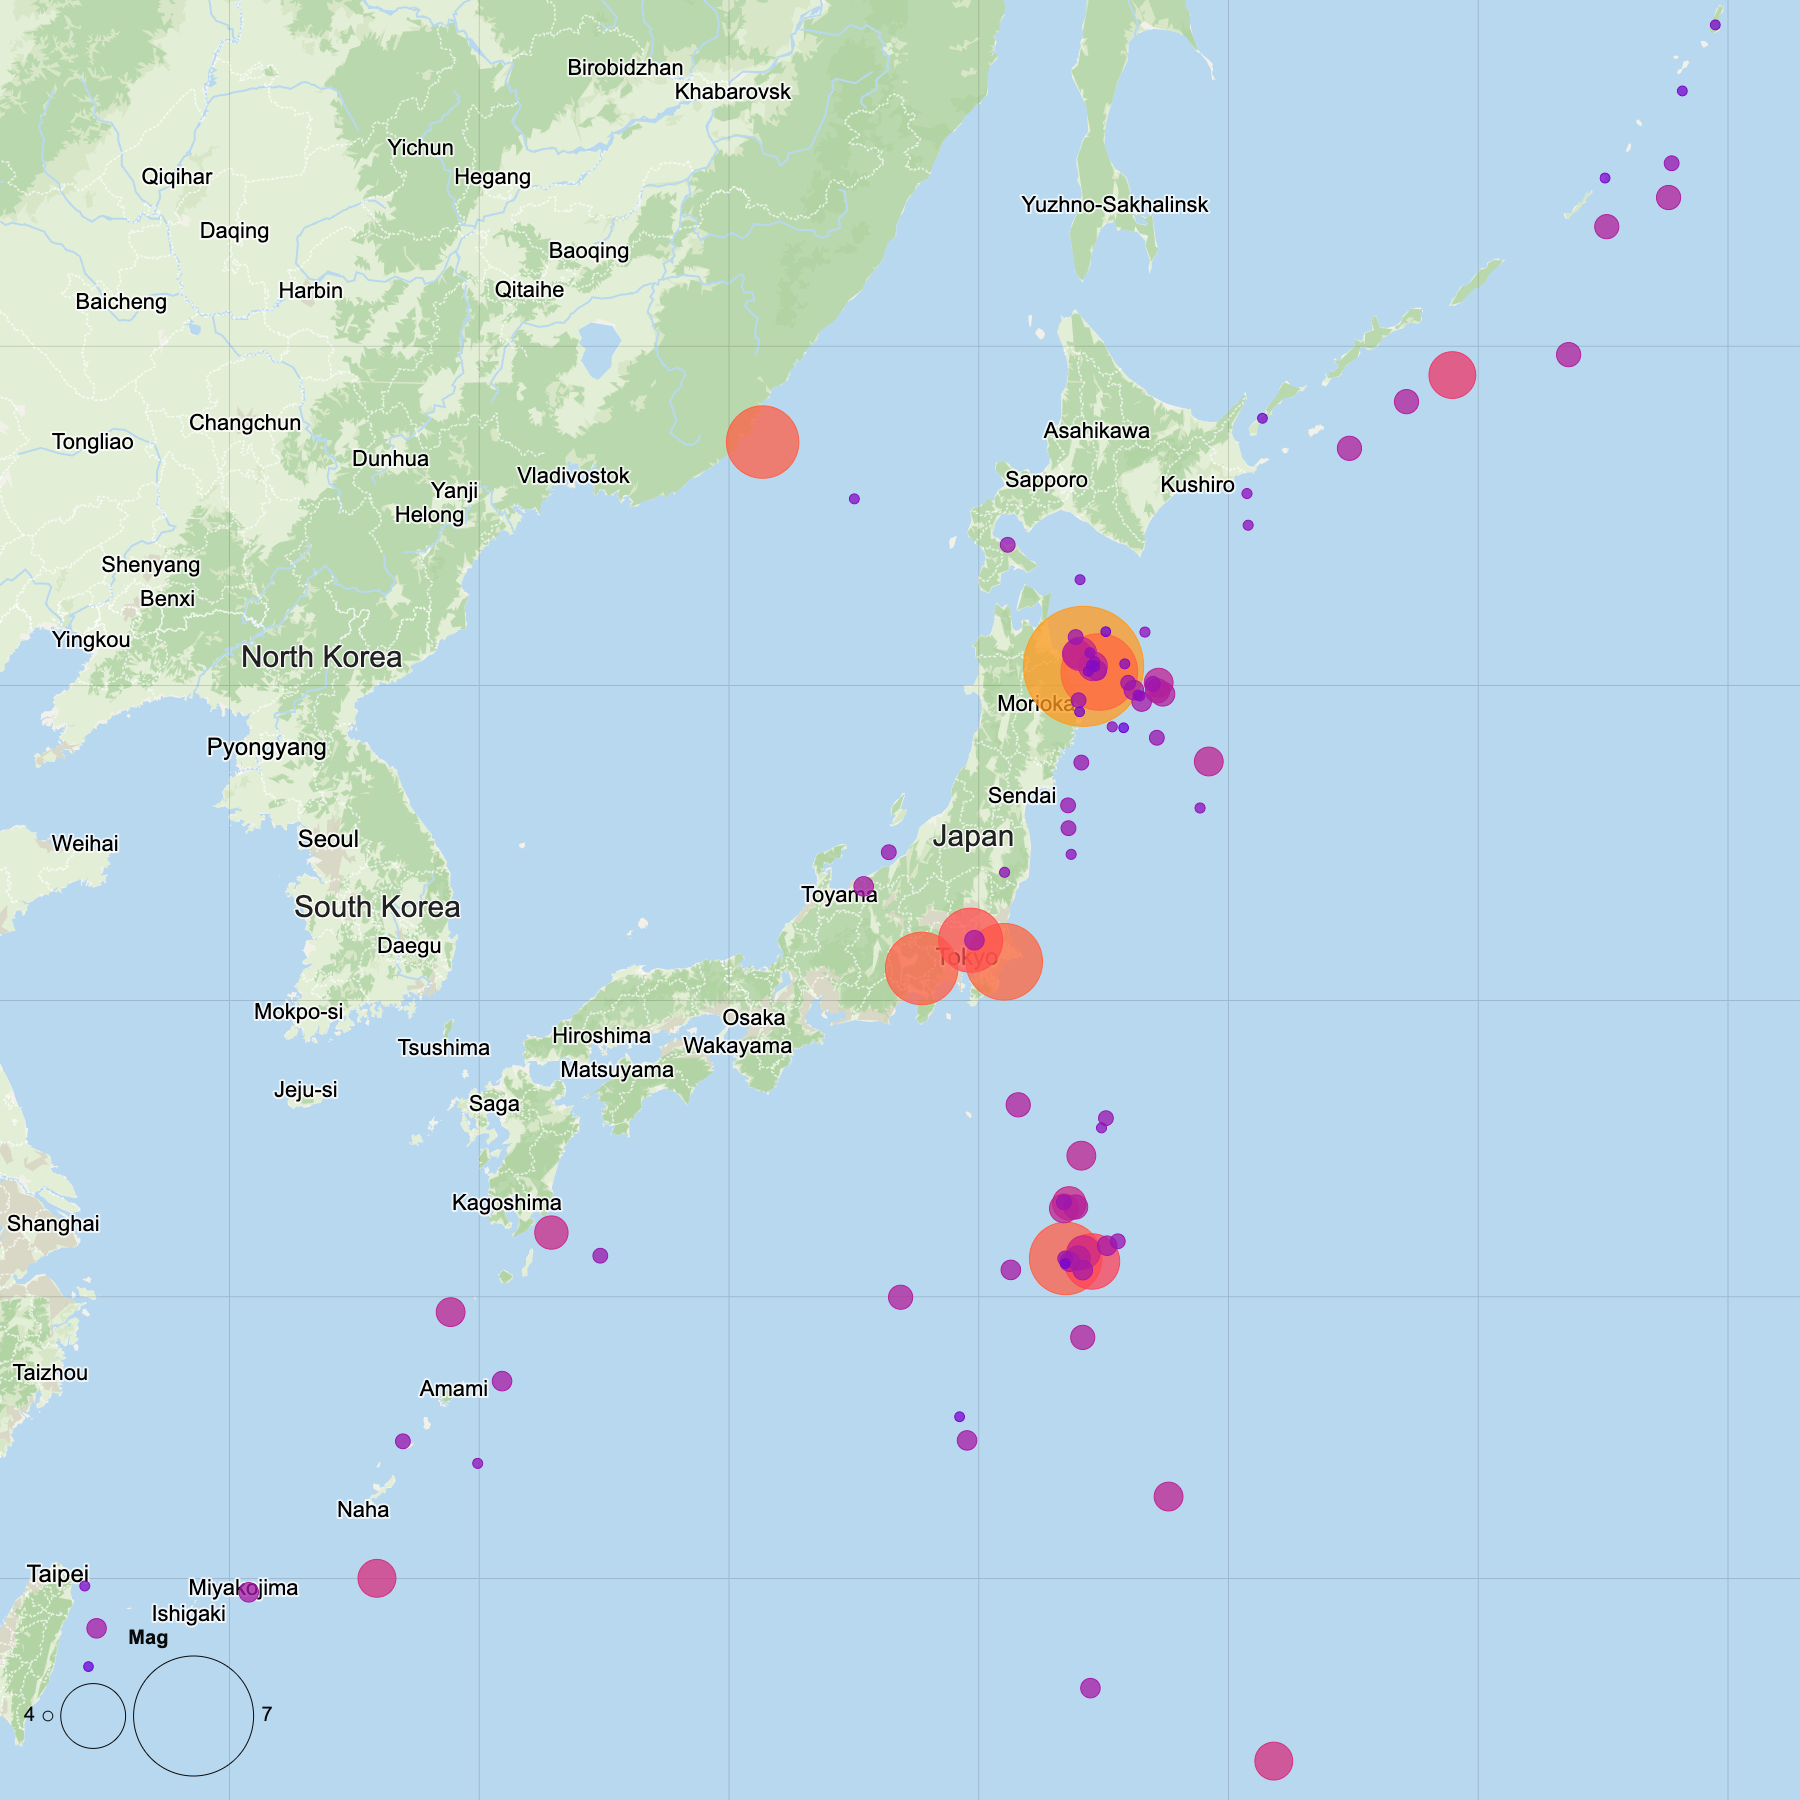
Map a public USGS GeoJSON feed and style earthquake points by magnitude, depth, or significance.
Build the map from a public earthquake feed so the source can be refreshed later. Paste the USGS GeoJSON query URL to create the layer directly from the source.
The feed includes a numeric 'mag' field for earthquake magnitude. Attach magnitude to point size so stronger earthquakes stand out, then use color or opacity for another field such as depth.
This regional earthquake graphic benefits from visible latitude and longitude lines. Turn on graticules and set the interval to 5 degrees so readers can better understand where the quakes are located.
Labels should add context without cluttering the map. Turn on labels for useful place names or notable records and let collision handling keep them readable.
Create a new map, load the source data, and use this workflow as a starting point for your own editorial or design project.