Load the precinct GeoJSON
Create a new map and upload the precinct file from the guides data folder. The source already includes precinct polygons and election result fields, including 'pct_dem_lead'.
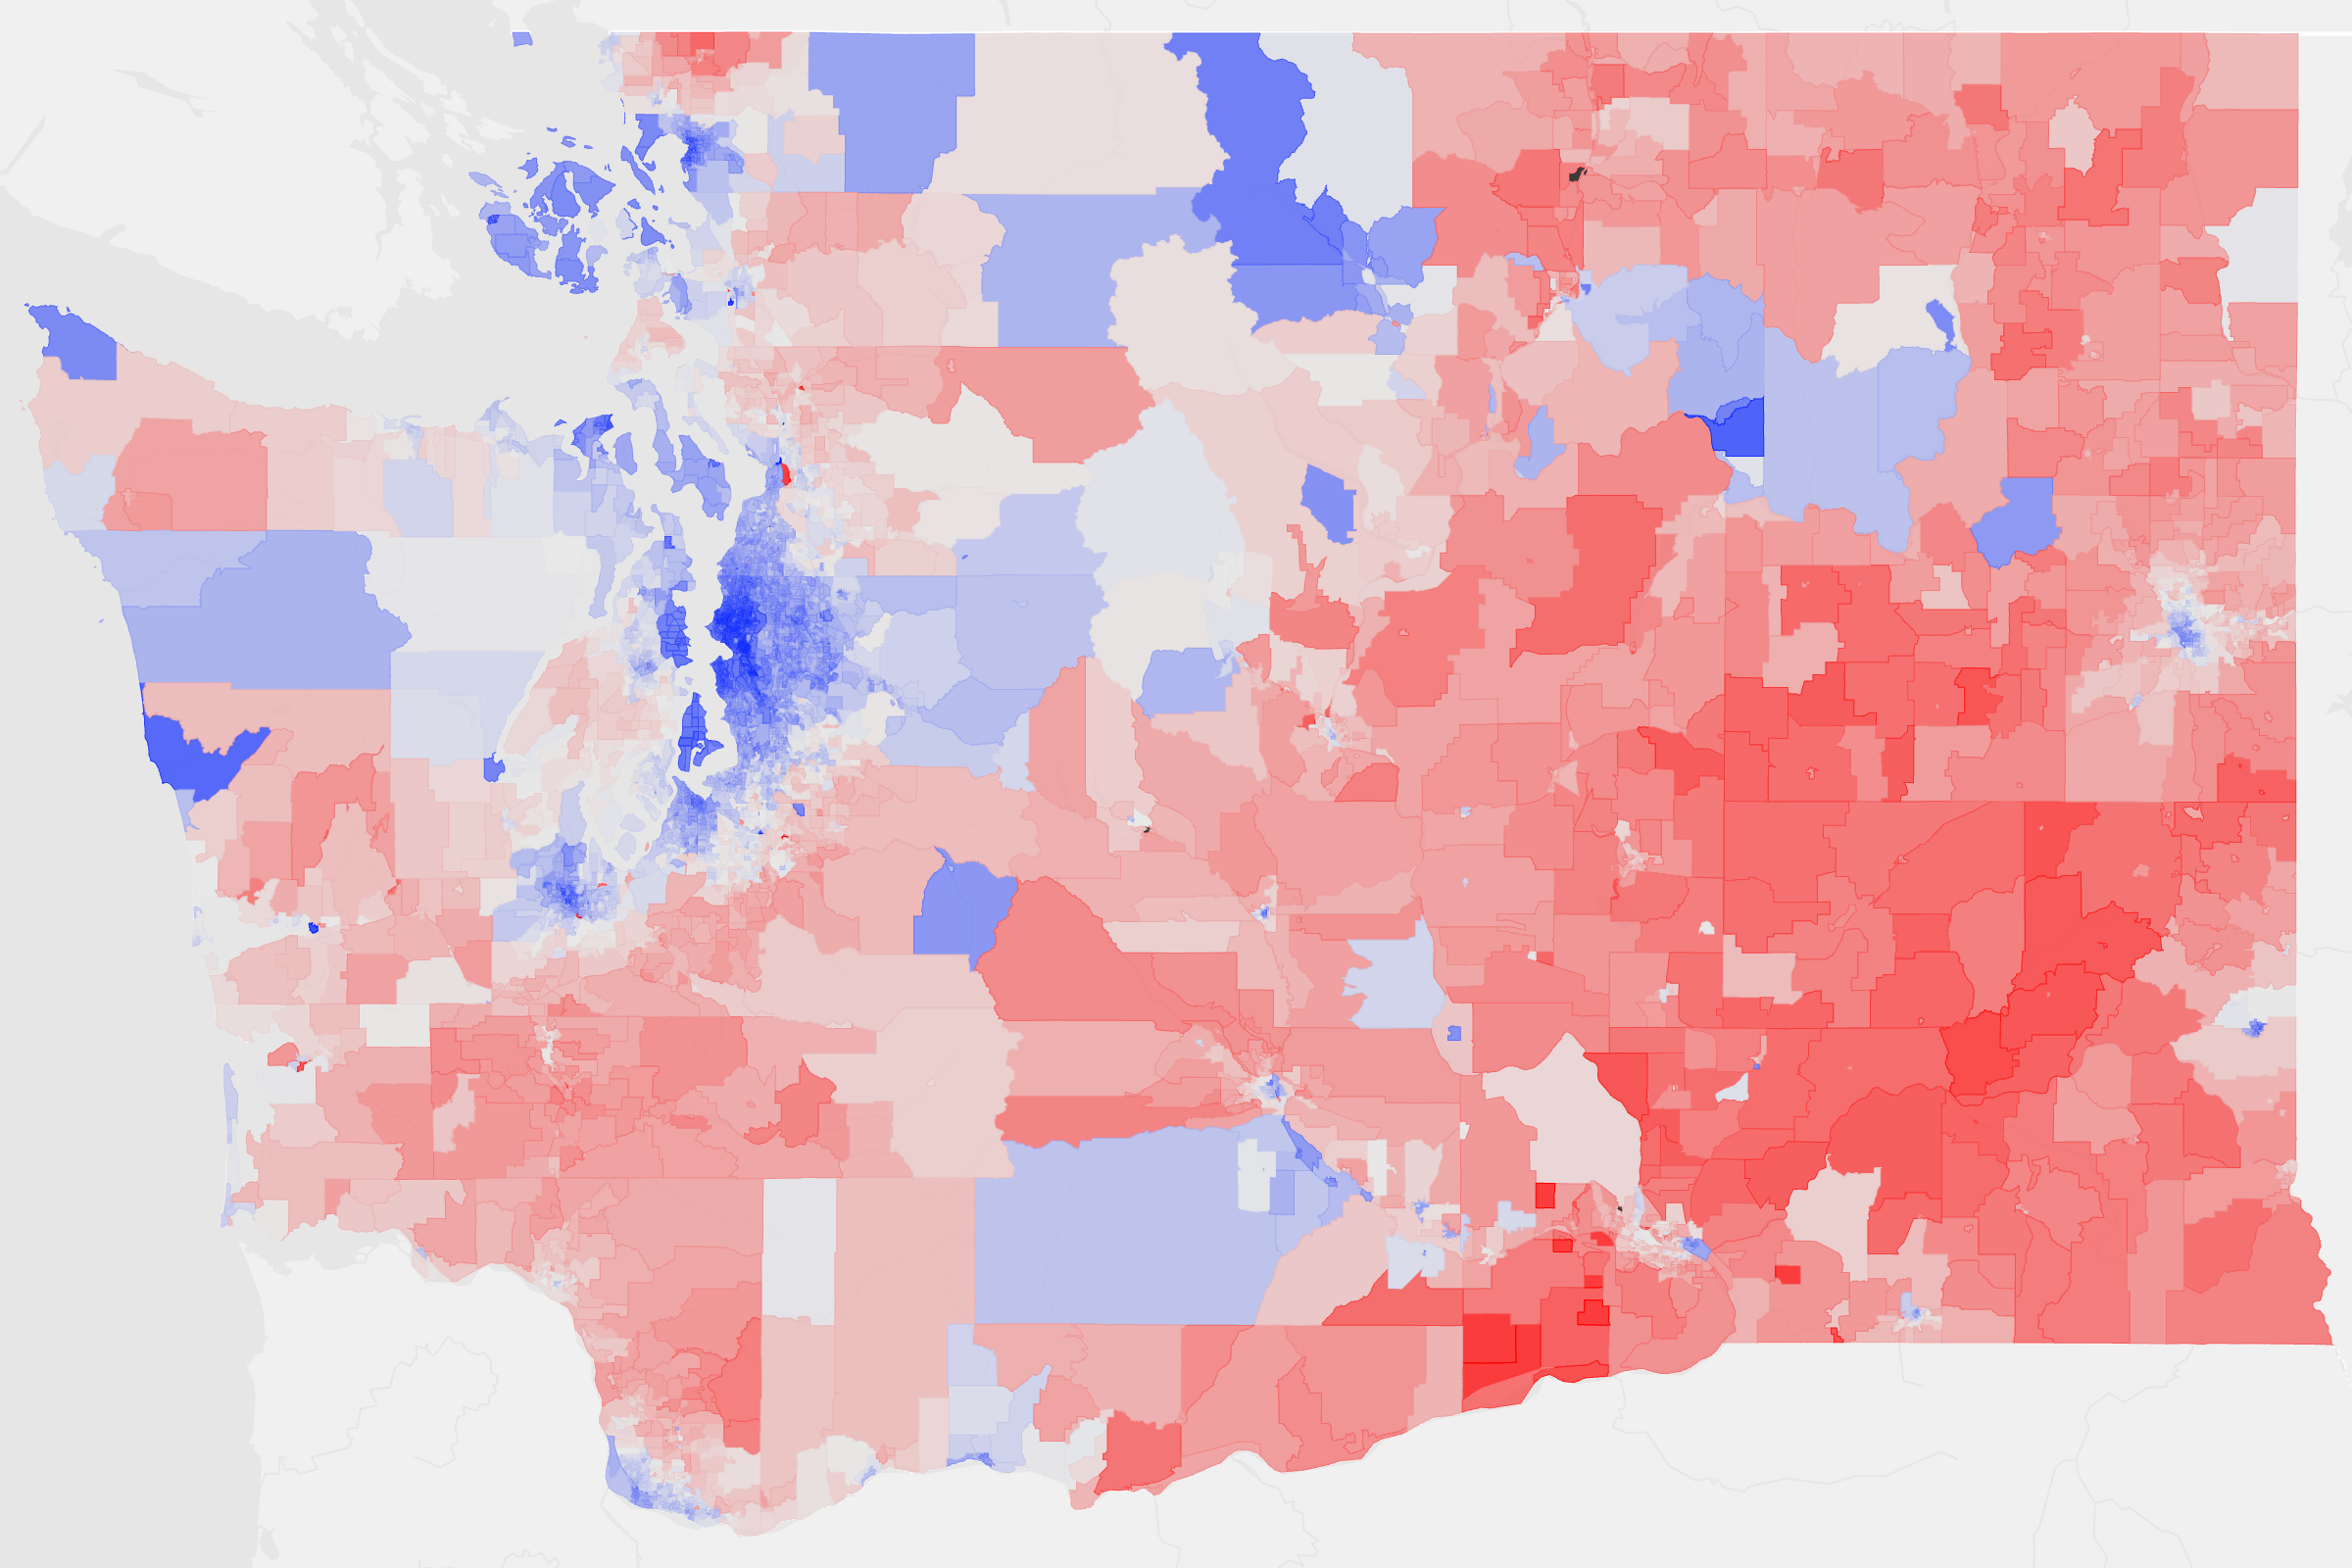
Build a state precinct map from 2020 election results and style partisan margins with a diverging red-blue scale.
Create a new map and upload the precinct file from the guides data folder. The source already includes precinct polygons and election result fields, including 'pct_dem_lead'.
Open the layer editor and set Color to 'pct_dem_lead'. Because the values diverge around zero, this field is a strong fit for the Diverging color mode.
Open the Palette menu and choose the system 'Political' palette so the map uses a familiar red-blue election color scheme.
Use the reverse color button next to the Color dropdown so Democratic values map to blue and Republican values map to red, with the center of the scale staying neutral.
Turn on the Color legend if needed, confirm the midpoint reads as the neutral break around zero, then export SVG or PNG for publishing.
Create a new map, load the source data, and use this workflow as a starting point for your own editorial or design project.